Research Hub · free while we launch
A review workspace your whole team can use.
For systematic and scoping reviews, from the first search export to the PRISMA diagram in your manuscript. Unlimited reviews, records and reviewers.
Research-only accounts see no exam prep at all.
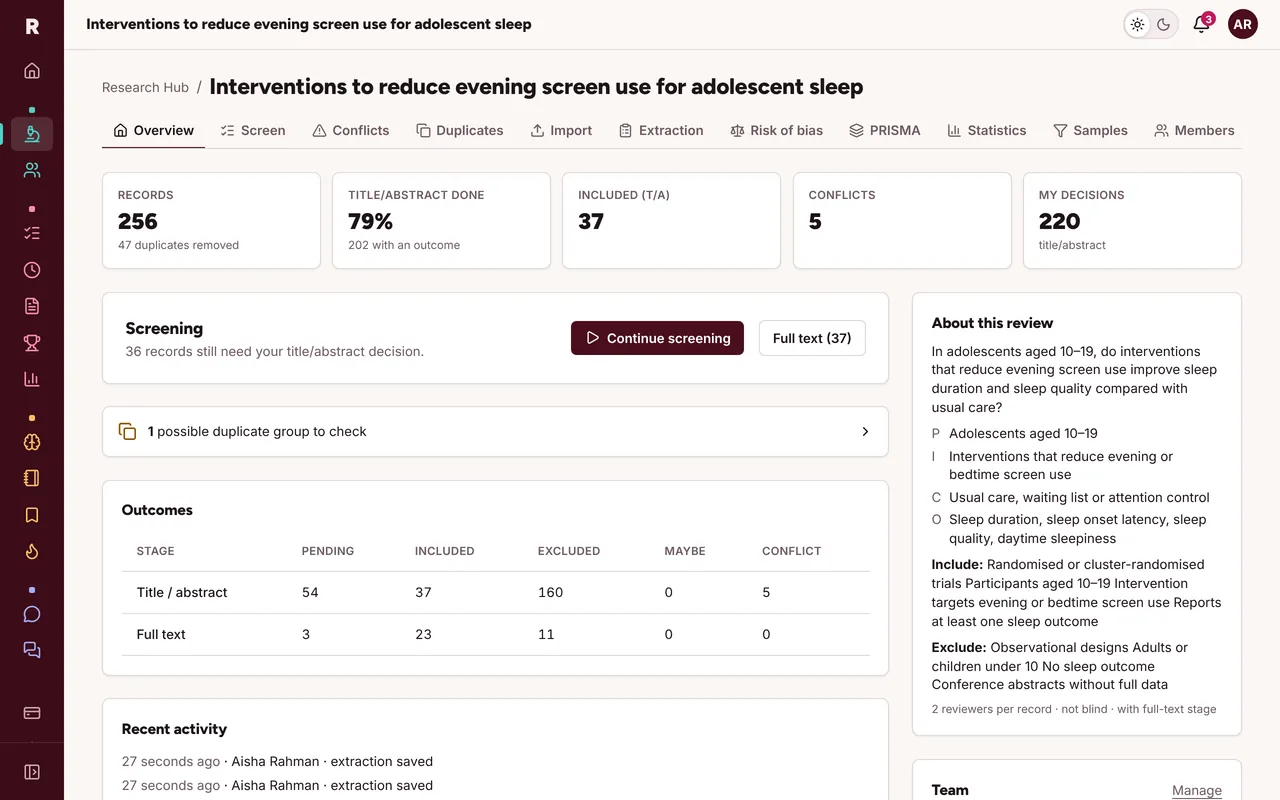
Screening
A workbench built for long sessions.
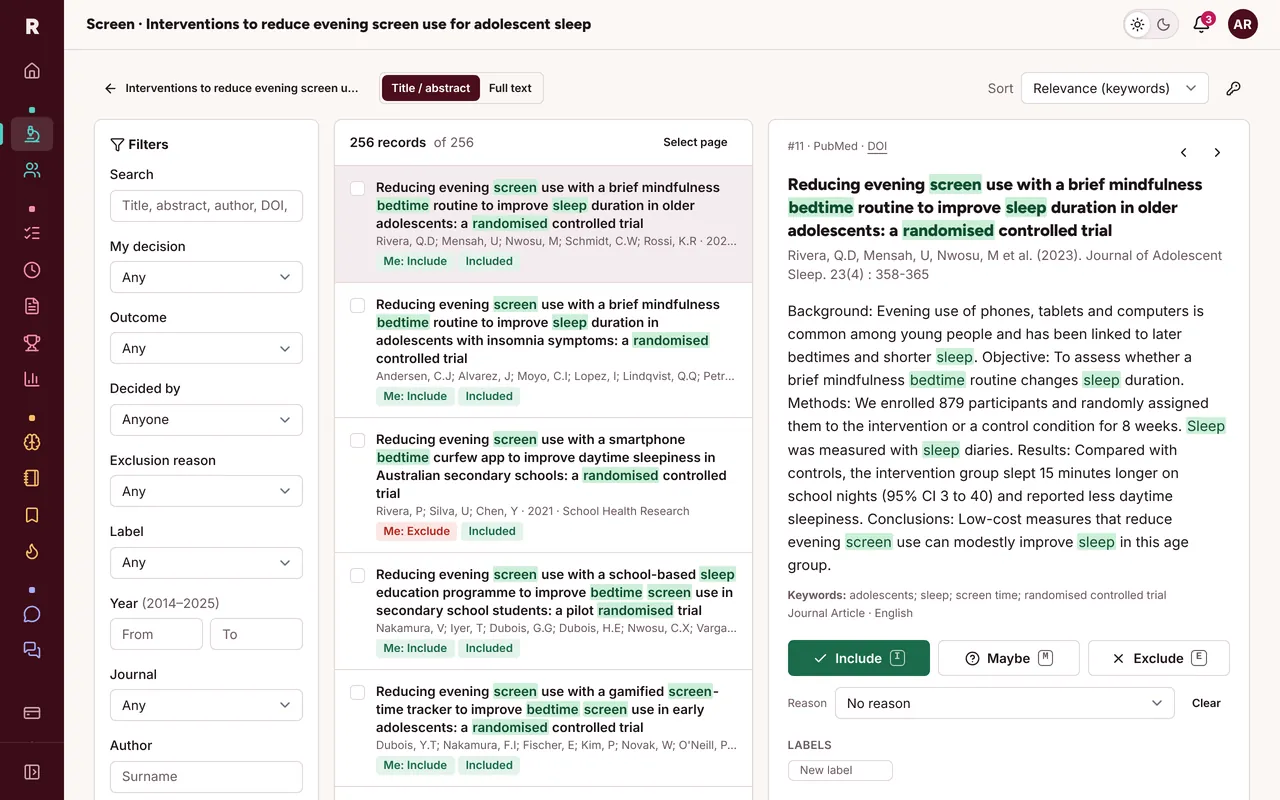
Records on the left, the abstract on the right, and your decision one key away. Inclusion and exclusion terms are highlighted, records can be ranked by your keywords, and bulk actions handle the obvious exclusions.
- 19 filters, including decision, outcome, reviewer, reason, label, year, journal and source
- Notes and labels on any record; full-text PDFs stored privately
- Shortcuts you set yourself; undo with U
Duplicates
Duplicates found for you, and explained.
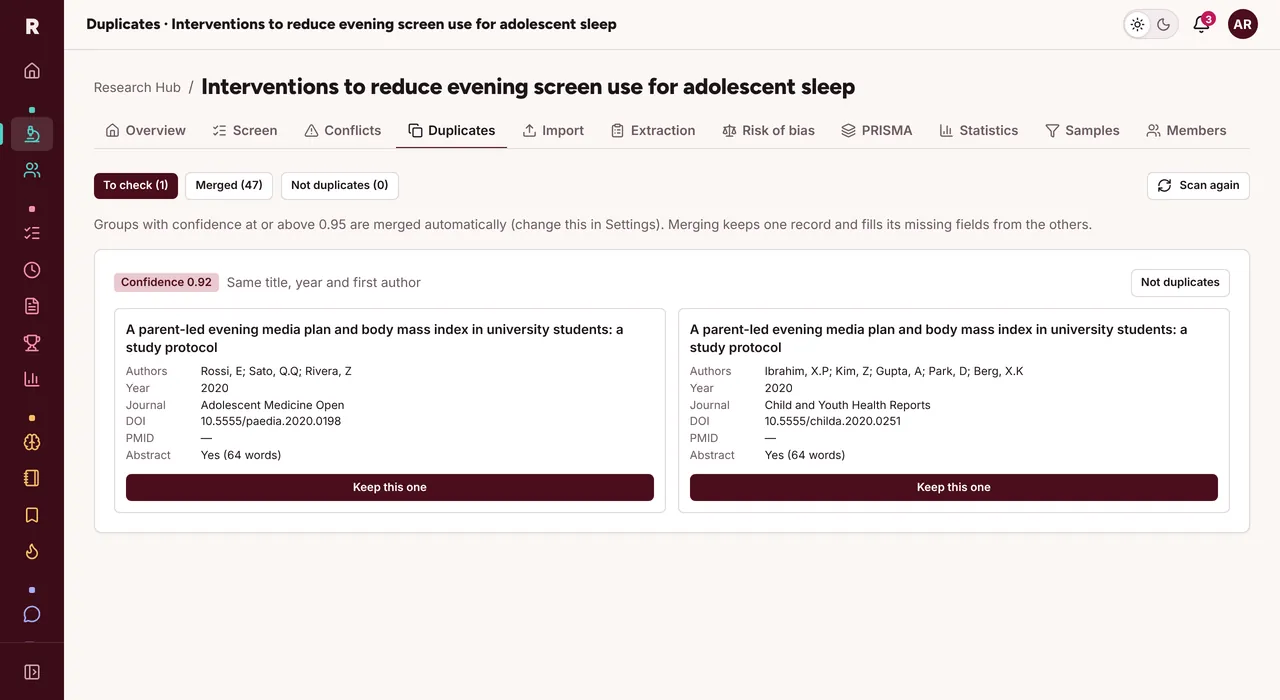
Records are matched on DOI, PubMed ID, or title, year and first author, each with a confidence score. Matches above your threshold merge automatically; the rest are shown side by side so you can keep the more complete record.
- Merges can be undone
- "Not duplicates" is remembered
- Merged records are hidden from screening, never deleted
Reporting
PRISMA 2020, ready to download.
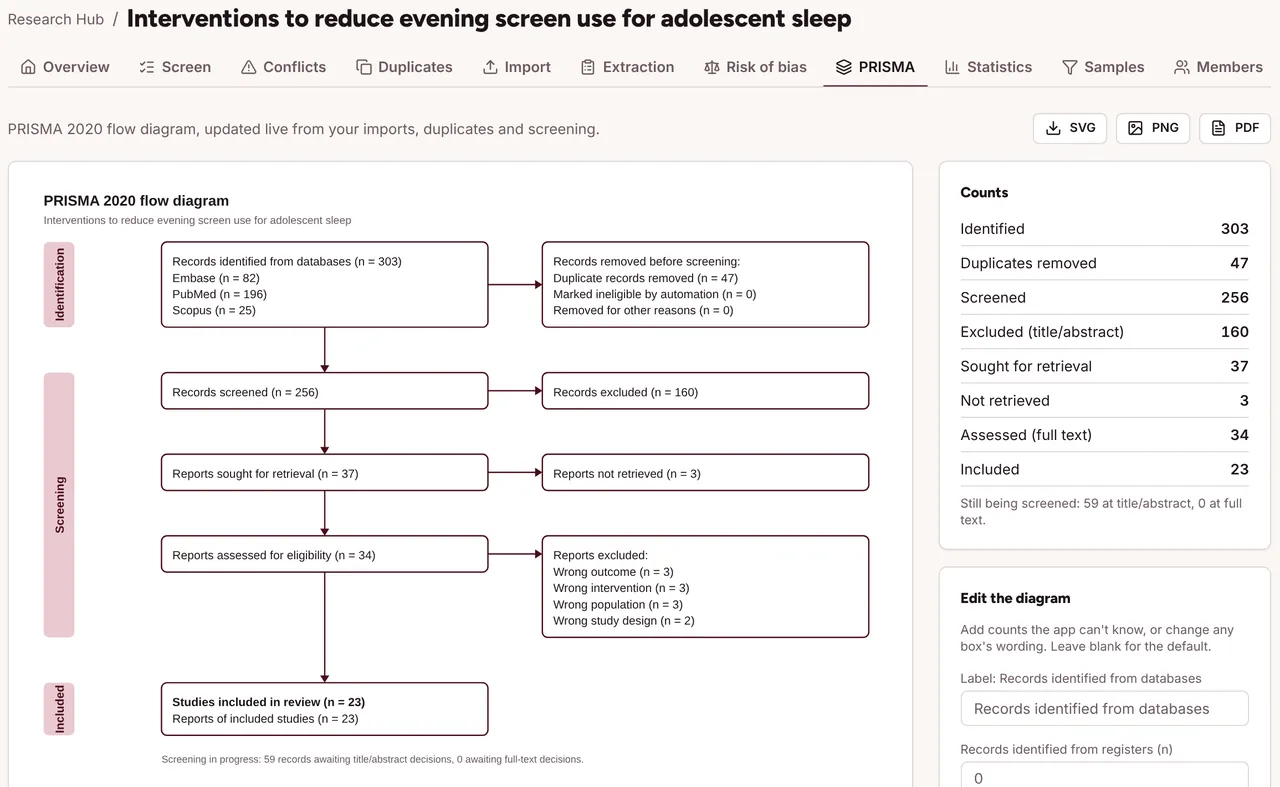
The diagram is drawn from live counts once blinding is off. Reword any box, add counts from registers or automation tools, and download SVG, PNG or PDF.
- Per-database counts from your imports
- Full-text exclusion reasons listed automatically
- Reports not retrieved counted separately
Risk of bias
RoB 2, ROBINS-I and Newcastle–Ottawa.
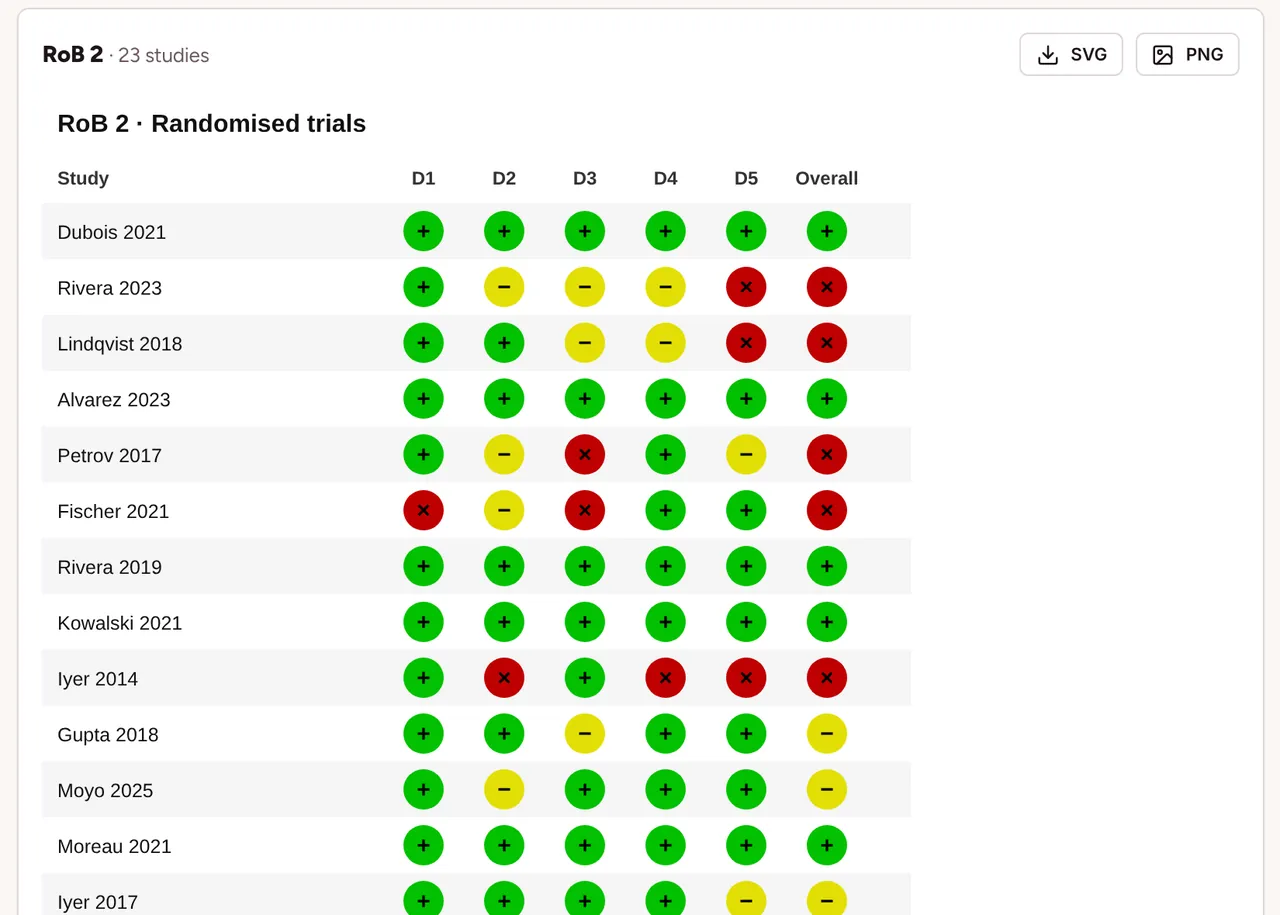
Assess each included study with the right tool. The overall judgement is suggested from the domains, and you can override it with a reason. The traffic-light plot uses robvis colours and symbols, so colour is never the only signal.
- Download the plot as PNG or SVG
- Summary bars for every domain
- Export judgements and support text to Excel
Also included
- Imports
- RIS, BibTeX, PubMed (.nbib), EndNote XML and CSV, detected from the file itself, up to 20,000 records per file. Or search PubMed directly.
- Blinding
- Enforced on the server: others' decisions, notes, labels, outcomes, kappa and PRISMA totals stay hidden until the owner turns it off.
- Conflicts
- Resolved by the owner or a third reviewer, and locked until the owner reopens them.
- Agreement
- Cohen's kappa for each pair of reviewers with the Landis and Koch label; random samples for calibration.
- Data extraction
- A starter form with sections and typed fields you add; one shared form per study, with the last editor shown.
- Teams
- Invite by email or a join link you control. Owners, reviewers and viewers; a chat channel for every review.
- Exports
- CSV, RIS and Excel of all, included or excluded records with each reviewer's decisions. Spreadsheet formulas can't sneak in.
- Audit log
- Every decision, merge, resolution and edit, with who did it and when.
- No AI guesswork
- Relevance ranking uses your own keywords, and PICO tagging is a form you fill in.
Start your review today.
Create an account in a minute. Pick "Research Hub only" and you'll get a dashboard with nothing but your reviews.